
Maintaining industrial machinery efficiently
Schematic Capture
Schematic Capture allows field technicians of Alloy Technology Solutions (ATS) to quickly capture and annotate images of industrial-size machine parts, and document the maintenance status with accuracy. ATS and its clients use the information uploaded by technicians to report or receive approvals for replacement of machine parts.
Role
UX / UI Design,
Information architecture
Time frame
3 months
Team composition
1 UX designer
4 Frontend developers
1 Backend developer
Objective
Improving Schematic Capture v0
ATS had existing mobile and web apps (Schematic Capture v0) to assist technicians in documenting machine parts. My objective was to address the shortcomings of the existing apps by reconstructing the core user flows and visual display of data.
Schematic Capture v0
Background
Manual process before digitization
Technicians worked using printed lists of machine parts. They captured images with their phones, then went home to annotate the images and complete the maintenance notes for almost 200 parts in a single day. This process could take up to 12 hours end-to-end.

Schematic Capture v0
To digitize the process, ATS designed Schematic Capture v0. However, technicians found the documentation process within the app to be so unclear and disorganized that they preferred to stick to the manual process.

Information hierarchy
To identify why technicians found it confusing I sat down with them and the founder of ATS to really hash out the information hierarchy of Schematic Capture. The best way I could visualize the layers of information was by building a cake.

Shortcomings of v0
When discussing the issues with the technicians they let me know that there was a big problem with the way the information was organized. The main shortcomings of Schematic Capture v0 were:
-
They could not organize their work by Client
-
They could not identify the status of their work/projects
-
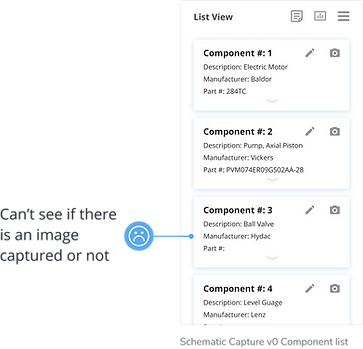
They could not see whether an image was captured


Schematic Capture v1
Exploring the updates in the structure and designs
Based on the information hierarchy, I designed a new flow that mimics the manual process technicians used. As a result, technicians are more receptive to using it boosting the adoption rate from 10% to 80%.
Schematic Capture v1 process
Compared to v0, Schematic Capture v1 reduces the time spent by technicians to complete their tasks by 16%, and it improved the accuracy by 125% ( 9 out of 10 error-free uploads compared to 4 out of 10 uploads).

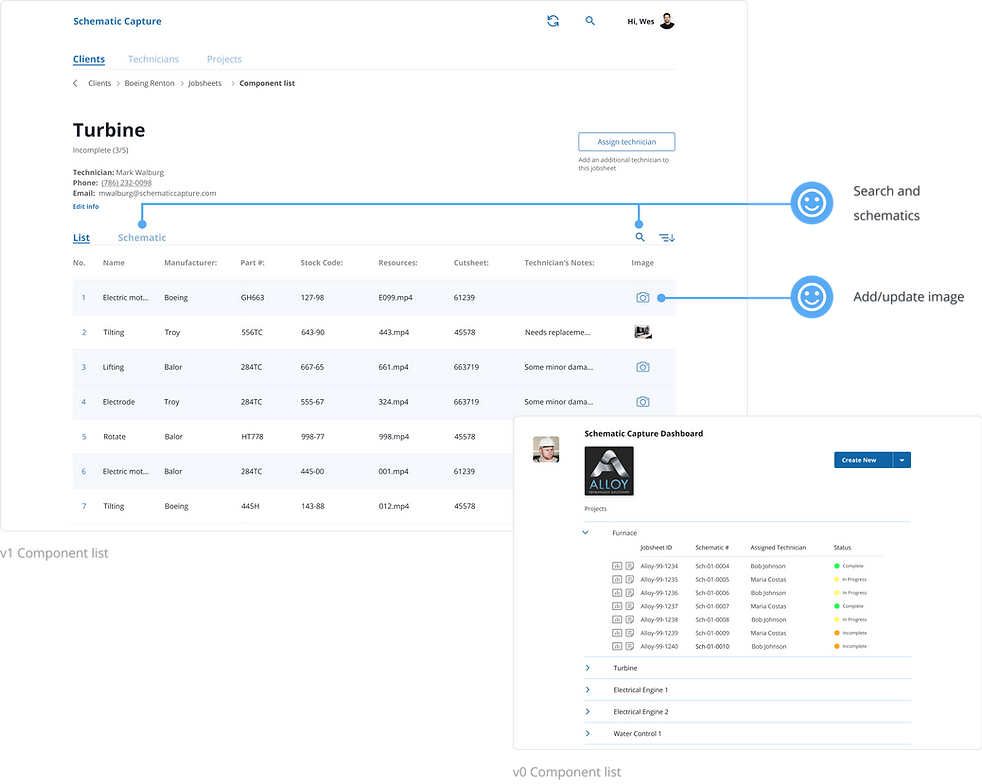
Dashboard updates
I updated the dashboard, which now has the ability to search and refresh/sync across devices. This was missing from v0.

Project list updates
In v0, having the header phrased as “dashboard” throughout the app confused users and made it impossible to know where they were in the process.
In v1, Projects are grouped by the Client and made visible through each step. Technicians are able to see the status and progress of each Project.

Jobsheet list updates
In v0, technicians were overwhelmed with the drop-down list of available Jobsheets.
In v1, Jobsheets are listed independently and grouped by the project (in this case the project name is Electric Arc Furnace).

Component list updates
In v0, the component list would open up into a CSV file that technicians needed to scroll through to get to the item they needed. There was no search option for them.
In v1, technicians are able to search for a line item as well as view the schematic drawing provided by the manufacturer. It is easier to identify components that need images.
Mobile screen updates
Mobile updates from v0 to v1 mimic those of the web app, making it a consistent experience across platforms.

v1 iteration process
My objective for the visual design of Schematic Capture v1 was to keep it as minimalist as possible while still displaying large amounts of information. I carried over some design elements from v0 into v1. For example, the font style and color used in v0 were suitable for both the web and mobile app and the primary color (blue) was complementary to ATS’s branding.

Dashboard iterations
The iteration process for the dashboard started out with grouping projects under the clients and displaying them in individual cards. But this idea was scrapped early on because the cards made it a little more visually confusing to the technicians. They preferred seeing just a list of clients and then moving into projects after selecting the client.

Project list iterations
At first, I was trying to identify both complete and incomplete projects but the visuals were too overwhelming for the technicians because there could be over 20 projects visible at a time. All the technicians cared about was identifying the incomplete projects.

Jobsheet list iterations
I explored different color combinations for the “incomplete” tags. I found that many combinations did not meet accessibility standards, but the filled tags with a darker text color worked best. All color combinations have been tested using color contrast checkers and colorblind simulation plugins.

Component list iterations
Initially, I highlighted the completed components for technicians but then quickly realized that the objective was to identify incomplete ones.
The final design is abundantly clear and draws your attention to exactly the information that technicians need to work quickly.

Component details iterations
Originally, component details were in a dropdown. I decided to put this information on a new screen because during the usability testing phase technicians were having a hard time with the tap targets.
I solved this problem by having the tap target for capturing an image on the right side and the tap target for details on the left side. In every page, blue was used to indicate affordance making it easier for the technicians to identify where they could tap.
Final designs
I redesigned the mobile experience to mimic the manual process technicians would use. The visuals are minimal and clean. Color is used sparingly, representing affordance or calling out attention to specific information.


Key takeaways
Patience and understanding
It took me some time to fully grasp the information hierarchy and objective of this project. Having a patient stakeholder who was willing to communicate his current process and provide examples of documents allowed me to put myself in the shoes of his technicians. In future projects, I will make sure to deep dive into how the product is intended to be used, and thoroughly understand the information hierarchy before starting my design process.
Consistency
Giving users a similar look, feel, and process across platforms resulted in less confusion and a more efficient workflow. By using similar design systems, my team experienced increased productivity and improved communication. In the future, I will continue to minimize friction between platforms by implementing as much consistency as possible in the functionality and design.